Dashboard Analytics
A Tool For Better Decisions
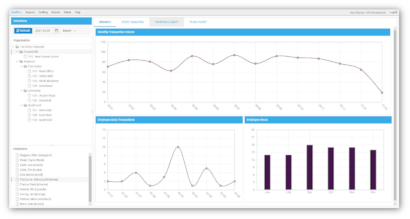
Decisions are only as good as the information that guides them. This is true for managers and leadership in all industries, not just banking. StaffPro has built it's Dashboard Analytics feature with this in mind. Each dashboard panel that comes standard in StaffPro was crafted with the mindset of providing the best quality data, distilling that data to a level that's useful to the user, and displaying that data in a way that makes sense for decision makers.
Unlimited Custom Dashboards and Panels
Subscribers to the standalone Dashboard module, or full StaffPro users that need custom metrics, can add any number of independent dashboards with any number of metrics in each dashboard. Custom panels are reasonably priced or can be developed internally, and data interfaces can be developed to support them.
Robust Set of Standard Dashboard Panels
While there is no limit to the number of dashboard metrics that can be added to StaffPro, subscribers to the full version of StaffPro receive a set of standard panels listed below.
-
Teller
- Teller performance measurement score chart
- Teller performance measurement score table
- Teller days worked versus out-of-balance
- Teller average transactions per hour – employee vs. peer group
-
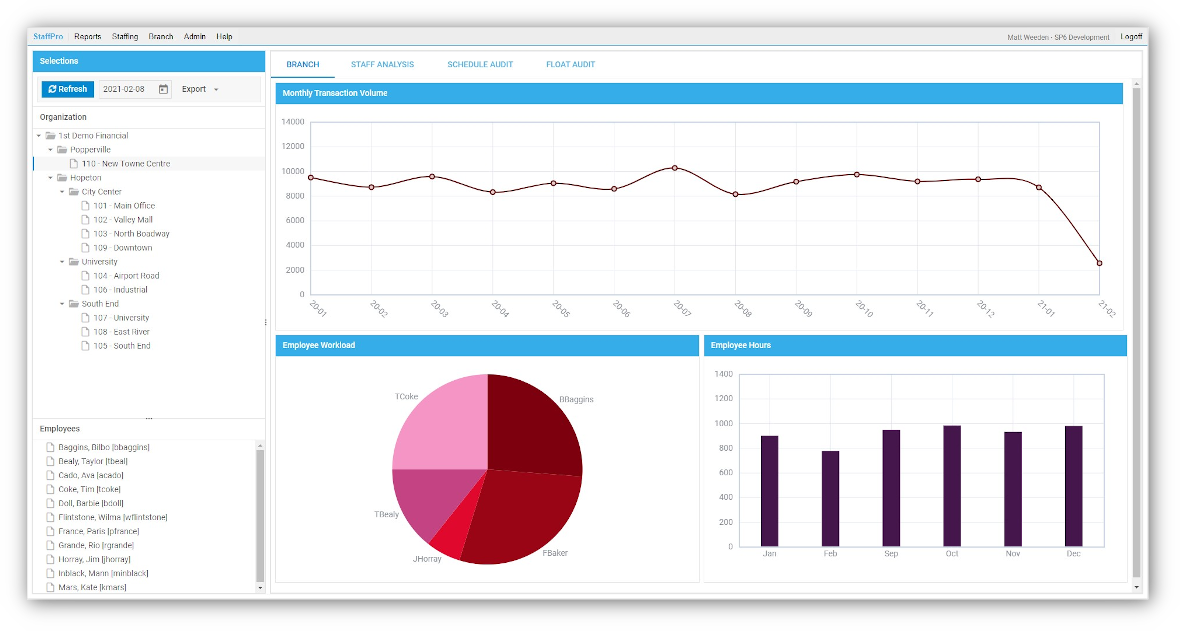
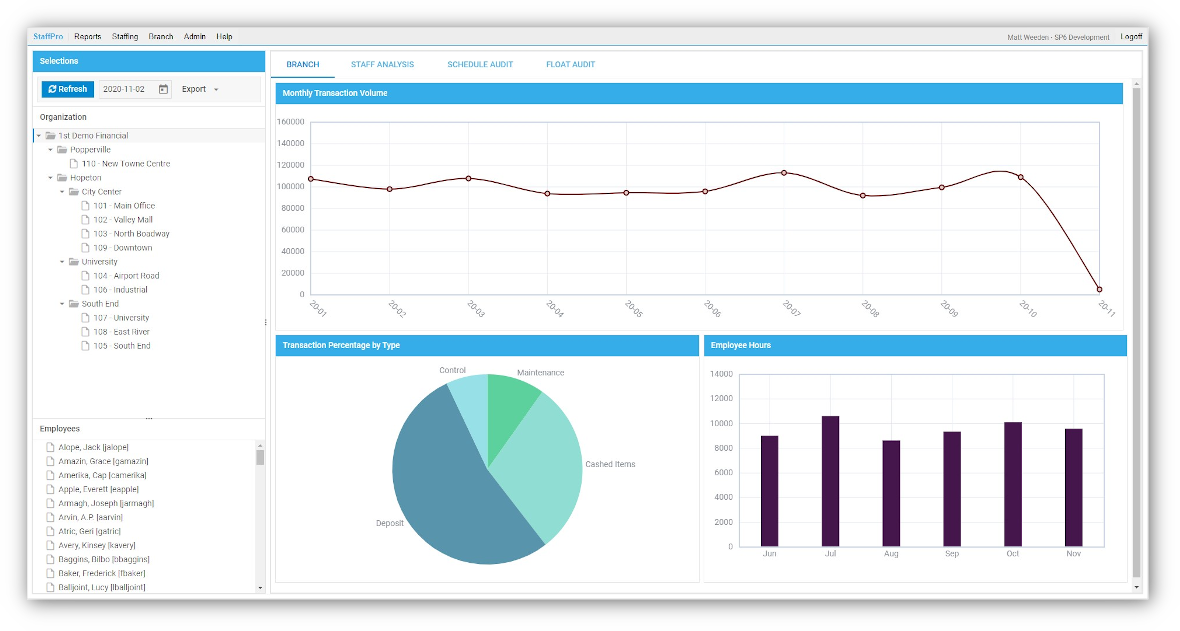
Branch
- Branch transaction volume chart (30 months)
- Branch employee workload percentage (at employee and branch levels)
- Branch transaction mix ratios (above the branch level)
- Branch average transactions by day of week (last 30 days)
-
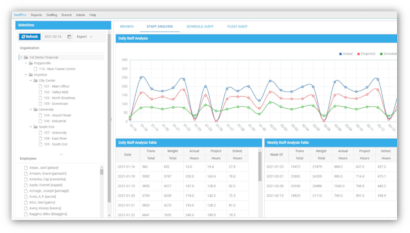
Staff Analysis
- Staff Analysis actual vs. projected vs. scheduled time
- Staff Analysis table of daily actual/projected/scheduled man-hours
- Staff Analysis table of weekly actual/projected/scheduled man-hours
- Schedule Audit table of weekly approved, scheduled, and overtime hours
- Float / Flex Audit table of weekly approved, scheduled, and overtime hours by pool
-
Cash Automation (additional data interfaces required)
- Cash Automation TCA vs. non-TCA transactions
- Cash Automation transactions per hour by TCA utilization tier
- Cash Automation days worked versus out-of-balance by TCA utilization tier
- Cash Automation table of utilization and average transactions per hour
Get A Clear Picture From Any Level
StaffPro lets you have multiple dashboards such as Branches, Loans, Call Center, etc. Each dashboard is a collection of any number of metrics that are associated with an organization hierarchy that is meaningful for whatever part of the organization the dashboard is serving. When a user clicks any level, the panels are refreshed and automatically rolled up to that level. Dashboards can even display different charts or tables at different organization levels, so that the information presented is relevant for that level.